OS4X Grafana Integration
OS4X supports the integration of Grafana (when using the MySQL/MariaDB database backend). It helps you automated in these tasks:
- check the authentication token
- create and check the data source
- create and check the dashboard
- publishing the dashboard anonymously, to be embedded as an iframe in the OS4X admin panel
If one of these tasks has to be manually
Requirements
A Grafana server with installed MySQL Data Source plugin is required. For the configuration of the integration you need an API token with administrative permissions.
Grafana server configuration
Since the panel is being embedded as an HTML iframe, the HTTP response header must not contain "X-Frame-Options: DENY". Change the Grafana configuration (default: /etc/grafana/grafana.ini) the following value:
allow_embedding = true
Restart Grafana afterwards:
systemctl restart grafana-server.service
Authentication token
The dynamic setup of the Grafana data source, dashboard and panel requires an administrative API token. You can generate one in the Grafana admin interface in "Administration" -> "Users and access" -> "Service accounts". Pick an existing service account or create a new one with role "Admin". Add a service account token. The token is only required during setup and can be removed afterwards.
OS4X configuration
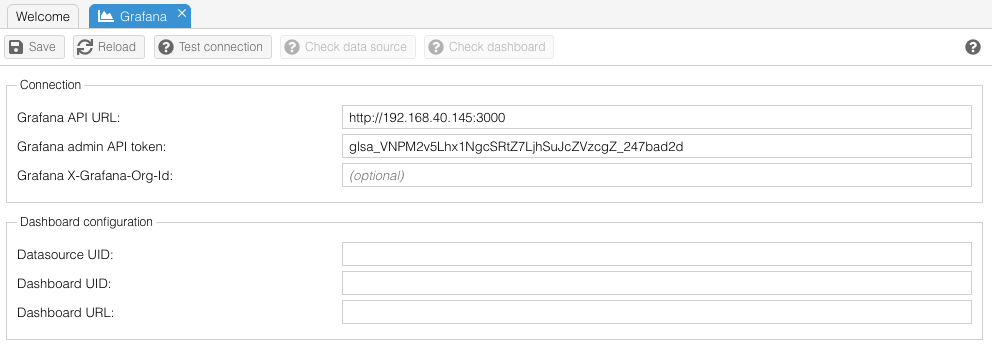
Navigate to "Configuration" -> "Grafana" to setup the integration:
Connection
After entering the Grafana API URL and admin API token (optionally an Org-ID value), you can click on "Test connection" which verifies the functionality. If it succeeds, the next button will be enabled.
Data source
The current database connection needs to be defined in Grafana. This only defines the connection, but cannot check its functionality. If something doesn't work with the connectivity, check the chapter "Error resolving hints" below. If the datasource isn't defined in Grafana yet, it will be added automatically. The value of "Datasource UID" will be filled out dynamically. If successful, the last button "Check dashboard" will be enabled.
Dashboard
The last button "Check dashboard" verifies the existance of a dashboard for this OS4X installation (identified by its dynamically created UUID). If the dashboard doesn't exist, it will be created automatically. This dashboard will be named "OS4X throughput per partner - <UUID>". This dashboard will be shared externally from Grafana, so no API token or authentication is required to access its panel. If everything works fine, the dashboard UID and URL will be added dynamically to the configuration panel. You are now ready to save the created and defined values.
Accessing Grafana graph
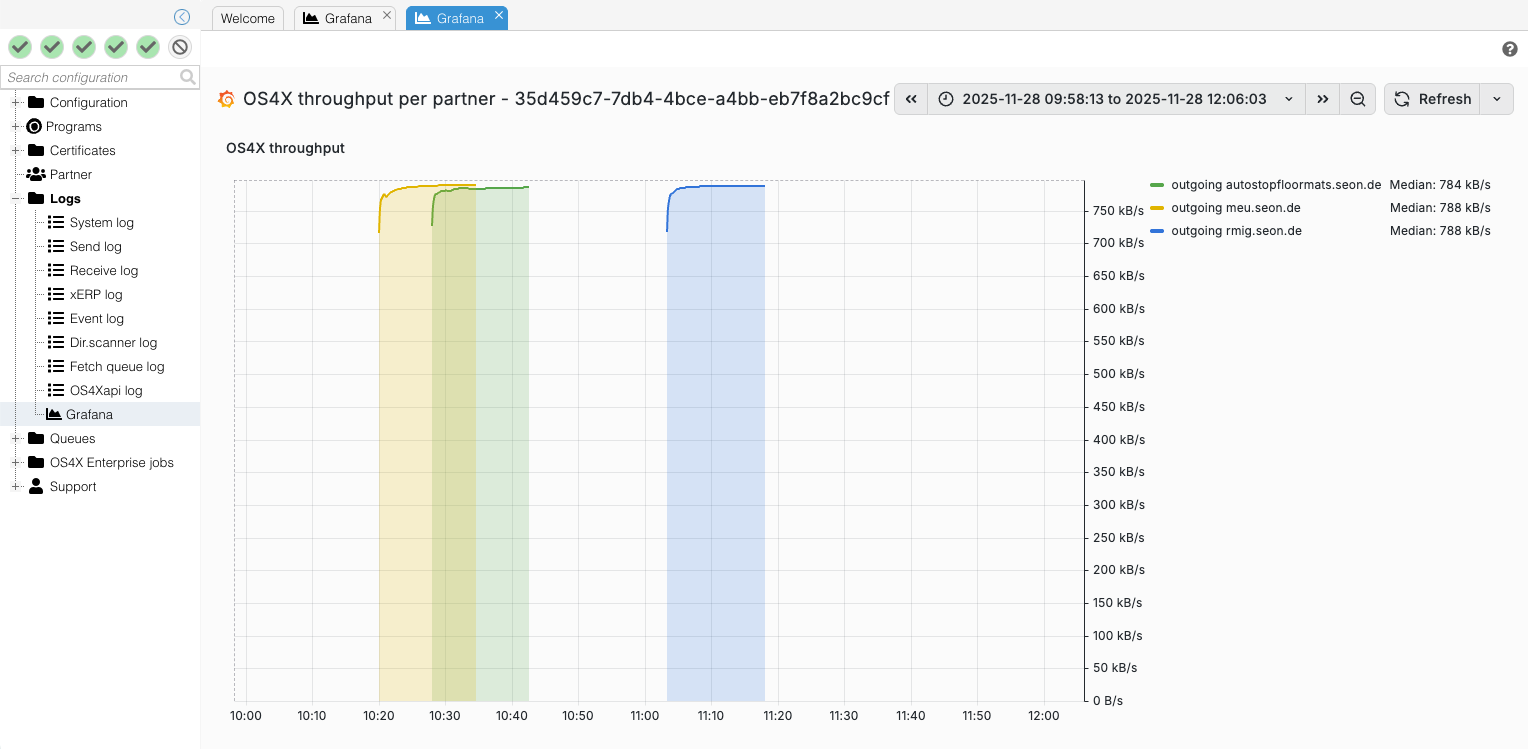
OS4X integrates the Grafana graph in a separate panel, accessible via the administrative web interface in "Logs" -> "Grafana":
Error resolving hints
Panel shows "No data"
The most obvious reason is missing permissions to the database by Grafana. Verify this by the following steps:
- In OS4Xadmin, navigate to "Logging" -> "Grafana", remember the title of the panel, especially the UUID after "OS4X throughput per partner" (i.e. "
408d85cc-64ab-4de7-aa25-9877a52225fd") - Navigate to the admin panel of Grafana (the URL provided in "Configuration" -> "Grafana" -> "Grafana API URL", i.e. http://192.168.40.145:3000
- Authorize as administrative user in Grafana
- Navigate to "Connections" -> "Data sources"
- Extract the data source with the same UUID as the panel's name (i.e. "
os4x-408d85cc-64ab-4de7-aa25-9877a52225fd"), click on that entry - Scroll down to the bottom, click on "Save and test". An error message should appear like this:
The error describes more details. In this case, the database user "os4x_cworks_de" from the resolved host "heimdall.lan" is not allowed to access the database.
Solution
Add a new database user to the database backend which is allowed to access the database and at least to select the following entities:
- table "
os4x_throughput", all fields - table "
os4x_partners", fields "idx" and "shortname"


